If you’re used to working with VMware, you probably know about the nifty little utility esxtop. This tool allows you to view real-time performance data on a ESX host. It also allows you to gather performance metrics in batch mode, which allows you to analyze the data in eg. Excel or ESXplot.
For those who are working with XenServer, a similar utility is available called xentop. The xentop utility allows you to monitor real-time performance metrics, like esxtop does. However, gathering data like in esxtop is a challenge.
The XenTop challenge
You can run xentop in batch mode by logging in to the console (either using XenCenter or eg. Putty) and running the following command (in the most simple manner):
xentop -d 5 -b -i 12 > /root/XenTop_Data.csv
The following parameters were used:
| -d | Delay in seconds |
| -i | Number of iterations to run |
| -b | Run xentop in batch mode |
Because we used the “-i 12” and “-d 5” parameters, the command will run 12 times with an interval of 5 seconds between every iteration (so 5 x 12 = 60 seconds). The data is redirected to a file, now when viewing the file (you can download the file from XenServer using something like WinSCP) contacts we can see what the challenge is (displayed a small snippet from the file content):
      NAME  STATE   CPU(sec) CPU(%)     MEM(k) MEM(%)  MAXMEM(k) MAXMEM(%) VCPUS NETS NETTX(k) NETRX(k) VBDS   VBD_OO   VBD_RD   VBD_WR  VBD_RSECT  VBD_WSECT SSID
  Domain-0 -----r       3903    0.0     753408    4.5     770048       4.6     4    0        0        0    0        0        0        0          0          0    0
GRID-DDC-0 --b---        270    0.0    3145700   18.8    3146752      18.8     2    1    43861    56735    2        0    44542    56657    1661098    2824383    0
W7GRIDK260 --b---         36    0.0    3145700   18.8    3146752      18.8     2    1      423      284    3        0    26186     2100     982356      34863    0
      NAME  STATE   CPU(sec) CPU(%)     MEM(k) MEM(%)  MAXMEM(k) MAXMEM(%) VCPUS NETS NETTX(k) NETRX(k) VBDS   VBD_OO   VBD_RD   VBD_WR  VBD_RSECT  VBD_WSECT SSID
  Domain-0 -----r       3903    4.7     753408    4.5     770048       4.6     4    0        0        0    0        0        0        0          0          0    0
GRID-DDC-0 --b---        270    2.0    3145700   18.8    3146752      18.8     2    1    43866    56737    2        0    44542    56657    1661098    2824383    0
W7GRIDK260 --b---         36    3.1    3145700   18.8    3146752      18.8     2    1      428      284    3        0    26196     2109     982820      34934    0
      NAME  STATE   CPU(sec) CPU(%)     MEM(k) MEM(%)  MAXMEM(k) MAXMEM(%) VCPUS NETS NETTX(k) NETRX(k) VBDS   VBD_OO   VBD_RD   VBD_WR  VBD_RSECT  VBD_WSECT SSID
  Domain-0 -----r       3903    5.8     753408    4.5     770048       4.6     4    0        0        0    0        0        0        0          0          0    0
GRID-DDC-0 --b---        270    2.3    3145700   18.8    3146752      18.8     2    1    43868    56738    2        0    44542    56665    1661098    2824393    0
W7GRIDK260 --b---         37   13.7    3145700   18.8    3146752      18.8     2    1      430      284    3        0    26585     2136     994625      35656    0
As you can see, the header is redirected to the output file too. This provides a nice challenge when it comes to analyzing the data. We could write a script which parses this data, but luckily there’s an easier method getting the performance metrics.
XenCenter Performance Tab
In XenCenter, when a host is selected, you have the option to view the performance metrics by pressing the “Performance” tab. This will show you a nice overview of the host’s performance:

This is nice to review basic metrics, but not really usable for inserting into eg. Excel. Luckily this data is saved in a database called the Round Robin Database (RRD). Note that this database does not save all metrics for a long time. The data saved is as follows:
| Past 10 minutes | Sample rate is 5 seconds |
| Past 2 hours | Sample rate is 1 minute |
| Past week | Sample rate is 1 hour |
| Past year | Sample rate is 1 day |
This means that if you would like to review data from eg. 30 minutes ago, the minimal interval between 2 measured metrics is 1 minute. This could be enough for most use-cases, but if you want more granularity, you will need to capture the data manually.
RRD2CSV
For XenServer 6.1, Citrix released a nice enhancement pack called “Performance Monitoring Enhancements Pack for XenServer 6.1”. So if you’re still using XenServer 6.1, you will need to install this enhancement pack. If you’re using XenServer 6.2, it’s already part of the default installation.
RRD2CSV allows you to export performance metrics, gathered in the RRD, to be exported to a CSV file. When you run rrd2csv (without parameters) from the XenServer’s command line interface, you will already see that the output can be imported in eg. Excel. (it, like the name already tells you, will output performance metrics in CSV format) When you don’t define any parameters, it will output all enabled performance metrics by default. To capture this in a file, you can redirect the output to a file:
rrd2csv -n -s 5 > /root/RRD_Data.csv
The downside of RRD2CSV is that you can’t run it for a set period of time. You will need to stop the utility by pressing CTRL+C. Note that I used the following parameters for the rrd2csv command:
| -n | Display label name of the performance metric instead of GUID |
| -s | Interval in seconds between each iteration (minimum is 5 seconds) |
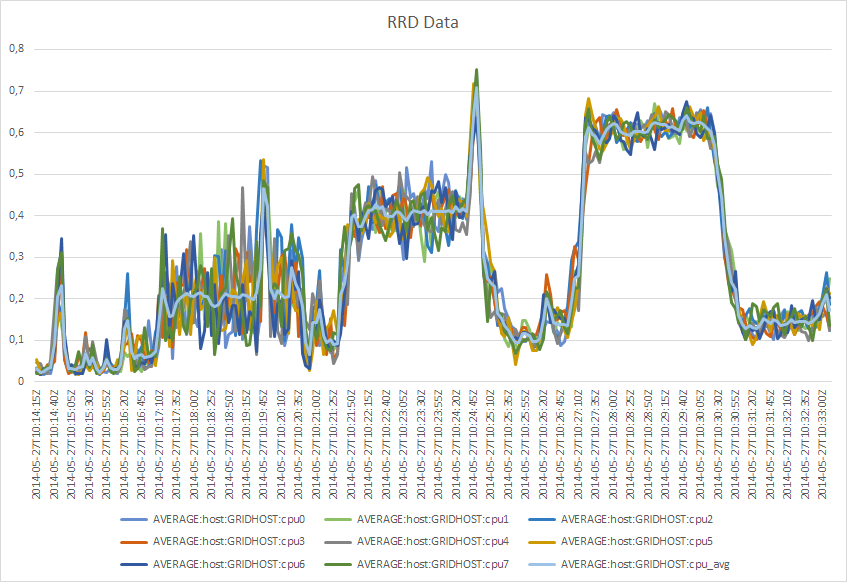
When you leave this utility running for a while and download the generated CSV using WinSCP. Now import it into eg. Excel and you can create nice charts:
Like I mentioned before, running the utility like this will gather all enabled performance metrics. I will describe how to make a selection of the metrics in a new post. I hope this post was useful for you. If you have any questions, leave a comment or send me an email.
Hello Floris,
I’m searching for a while now already if it is possible to view performance data with XenCenter from a remote location. I know that you coudn’t really do it in the past, but I have the idea it should work these day’s now.
I’m running XenServer 6.2 but when I connect with my XenCenter I can’t see any performance data comming in… Does this still only work when your on the same subnet? Or should it also be able to work across internet now?
Greating,
Wouter